

Our student Francesca Fontanella spent three months as as a visiting student at the Department of Geography and Environmental Studies at Wilfrid Laurier University in Waterloo, Ontario, Canada, where she worked as a part of a team exploring the population impacts of the severe 1976 drought in the East River region of South DAkota, USA. Working under the supervision of professors R. McLeman and P. Zatelli, she used statistical, geostatistical and cartographical modelling tools to investigate the extent to which rural migration patterns responded to the drought’s impacts on agricultural livelihoods.
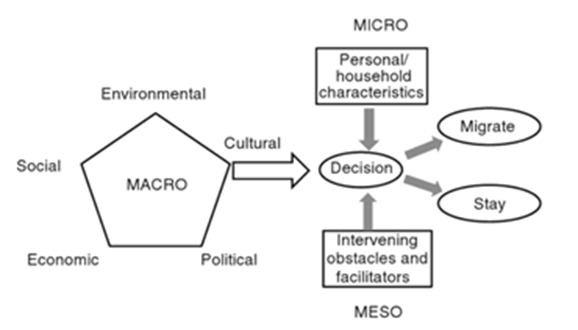
Environmental migration is a vast and complex topic. The decision to migrate can be defined as an adaptation response to the vulnerability of a given population to particular environmental hazards (McLeman, 2014). This is a relatively new field of research, and a case study approach allows for empirical testing of how social, cultural and economic factors interact with environmental drivers to shape migration responses.
MODIS Land Cover Product data had been used to identify and quantify changes in land use in the study area – approximately 2/3 being used for cereal crops and the remainder in grass, observing that there has been a gradual replacement of grass with cereal (for example, the area in cereal expanded by 7% between 2001 and 2018).
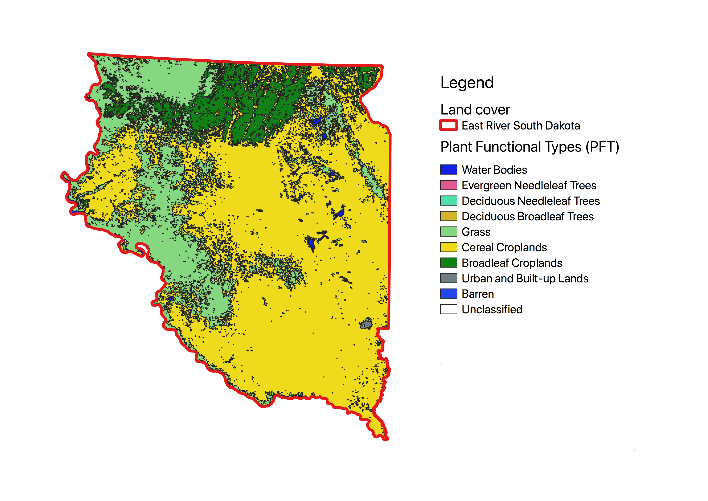
QGIS elaboration
The next step was to analyze county-level demographic trends over time, including urban and rural population distributions and distinguishing these for counties that experienced drought in 1976 versus those that did not.
The long term trend since 1930s has been for rural counties to decrease in population, while urban counties gained population. During the drought decade, the urban and rural population displayed a high degree of variation from the longer term trends. IN both drought-affected and non-drought counties, the urban population rapidly increased and the rural population rapidly decreased. After the drought decade, from the 80s the rural population in drought counties continued to decline, while the rural population in non-drought counties grew again.
Spatial autocorrelation analysis was carried out to identify clusters and outliers of population change. By highlighting atypical locations of population change spatial distributions, hidden patterns in the datasets were detected. For example, southeastern South Dajota was identified as a population growth “hotspot”, reflecting the expansion of the Sioux Falls urban area.
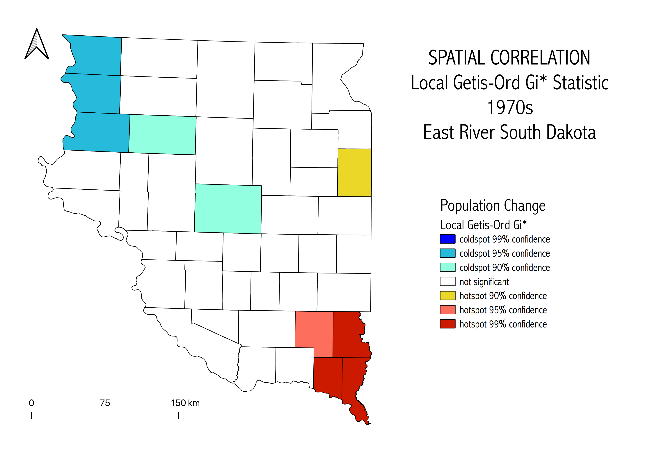
Spatial Autocorrelation analysis through Local Getis-Ord Gi* Statistic: Population Change hotspot and coldspot during the 70s. QGIS elaboration
It was also conducted tests of life-course migration theory (Plante et al, 2005) to investigate if droughts affect the age and gender profile of migrants. According to this theory, certain age cohorts are more likely to undertake migration, especially young people. The results showed that, while the Plane et al (2005) theory generally holds most of the time, the outcomes varied according to the cultural, economic and social context of the counties. Finally, the results obtained for total population data and net migration rates were compared, finding consistent patterns of difference in both dataset between drought and non-drought counties.
This work was made possible thanks to collaboration between the two universities and professirs McLeman and Zatelli and their respective departments and colleagues.
McLeman RA., 2014. Climate and Human Migration: Past Experiences, Future Challanges. Cambridge University Press: New York.
Plane DA, et al. 2005. Migration up and down the urban hierarchy and across the life course. Proceedings of the National Academy of Sciences 102: 15313-15318.